This article illustrates how to debug aspect-oriented code using the Visual Studio debugger. It builds on the previous discussion about how aspects transform your code, which included a side-by-side comparison of the original and transformed code as described at Understanding your aspect-oriented code.
Steps to debug aspect-oriented code
To debug code with aspects, follow these steps:
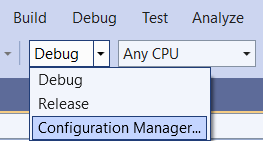
Step 1. Open Build Configuration Manager
From the debug setting dropdown, select Configuration Manager:
Step 2. Create a debug configuration named LamaDebug
The Configuration Manager displays the following dialog:
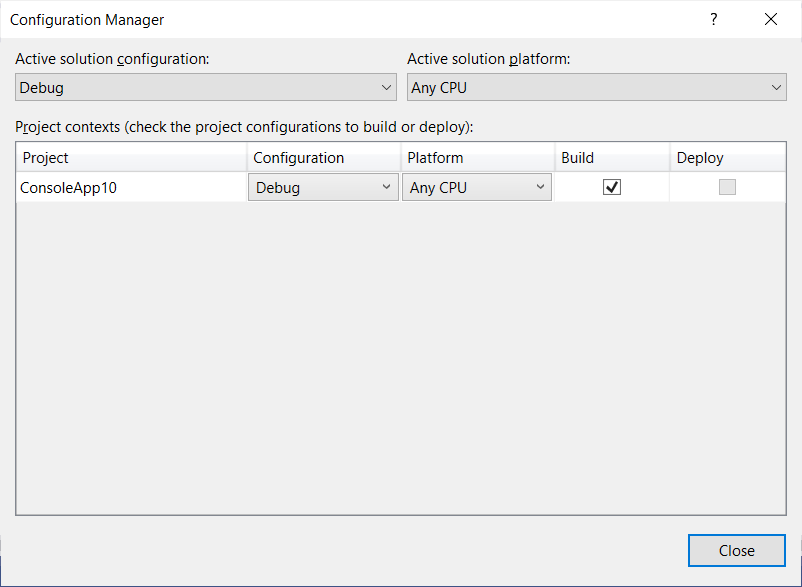
- Open the
Active solution configurationdropdown.
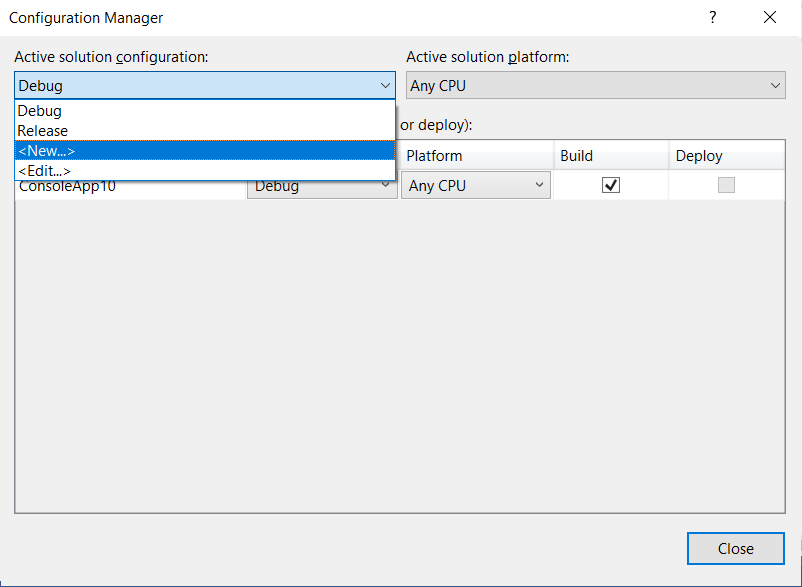
- Click
<New...>to create a new debug configuration. This opens the New dialog.
![]()
- Enter the name
LamaDebugand copy settings fromDebug.
- Save this configuration by clicking
OK. - Change the build configuration to
LamaDebug.
You're now ready to debug your aspect-transformed code.
Breakpoints and step-into
Warning
With the LamaDebug build configuration, you cannot set breakpoints in your source code files. The debugger only sees the transformed code, so breakpoints placed in source files will not be hit.
However, you can:
- Use
F11to step into the code as usual - Use a hardcoded
Debugger.Break()in your source to force a break at a specific location (see below)
The following sections show how to locate the transformed code and debug it.
Consider the following code with the logging ([Log]) aspect:
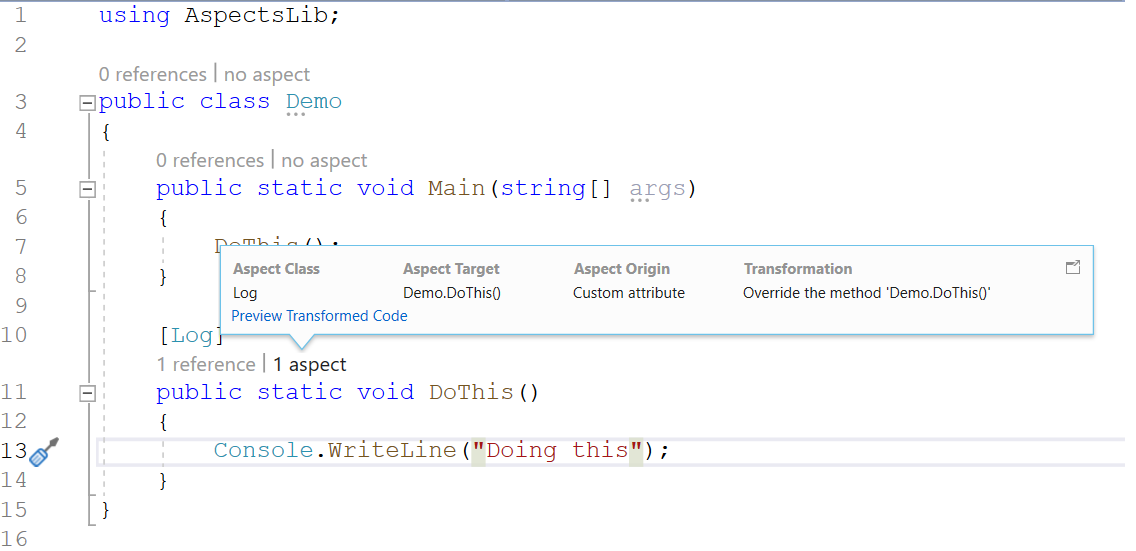
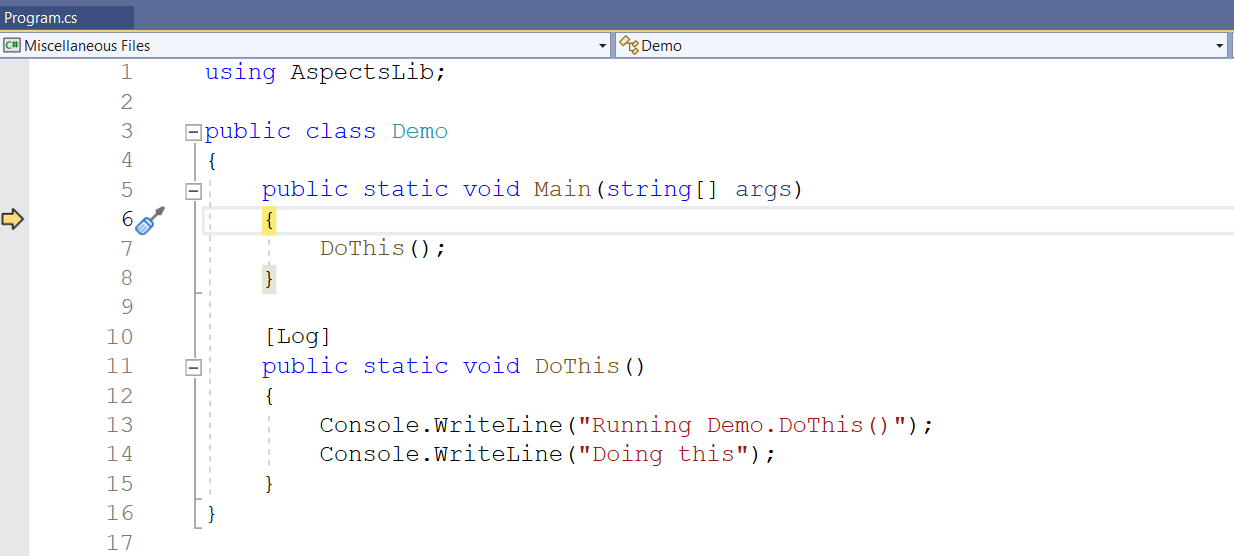
The logging aspect adds a line at the beginning of the method it intercepts, indicating the intercepted method name. When you step into this code by pressing F11, you see the transformed code.
Note
Note that the line Console.WriteLine("Running Demo.DoThis()") is generated by the Logging aspect in the AspectLib namespace.
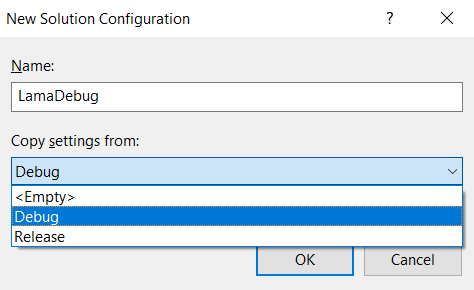
To locate the transformed code, click the Show all files button.
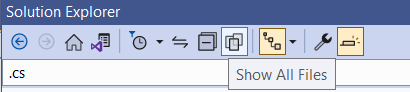
Once all files in your solution explorer are displayed, locate the file under LamaDebug\net10.0\metalama.
![]()
You can set a breakpoint on this transformed code, and it will be hit because this is the compiled code.
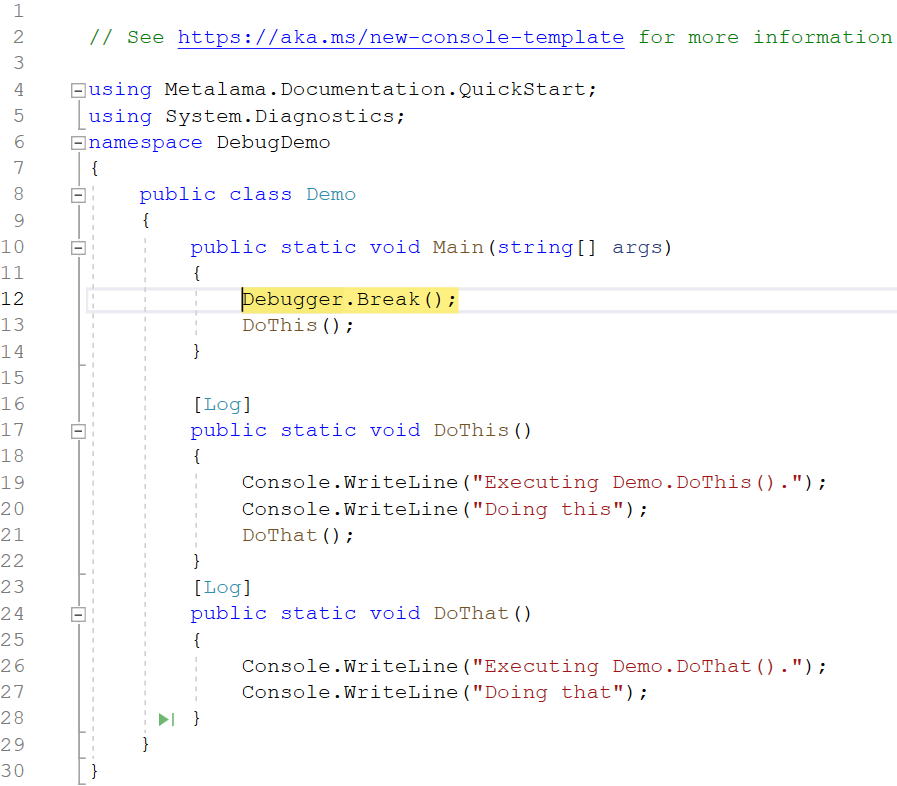
Debugging using step-into and forceful break
1using Metalama.Documentation.QuickStart;
2using System.Diagnostics;
3
4namespace DebugDemo
5{
6    public static class Demo
7    {
8        public static void Main()
9        {
10            Debugger.Break();
11            DoThis();
12        }
13
14        [Log]
15        public static void DoThis()
16        {
17            Console.WriteLine( "Doing this" );
18            DoThat();
19        }
20
21        [Log]
22        public static void DoThat()
23        {
24            Console.WriteLine( "Doing that" );
25        }
26    }
27}
1using Metalama.Documentation.QuickStart;
2using System.Diagnostics;
3
4namespace DebugDemo
5{
6    public static class Demo
7    {
8        public static void Main()
9        {Console.WriteLine("Executing Demo.Main().");
10            Debugger.Break();
11            DoThis();
12            return;
13        }
14        [Log]
15        public static void DoThis()
16        {Console.WriteLine("Executing Demo.DoThis().");
17            Console.WriteLine("Doing this");
18            DoThat();
19            return;
20        }
21        [Log]
22        public static void DoThat()
23        {Console.WriteLine("Executing Demo.DoThat().");
24            Console.WriteLine("Doing that");
25            return;
26        }    }
27}
Note
When you debug this code by stepping into it, you'll observe that the actual code being debugged is the transformed code.
Breaking forcefully using Debugger.Break
Use Debugger.Break to forcefully break the program.
Note
Add Debugger.Break to forcefully break the debugger at a specific location.